WOLFEYE REMOTE SCREEN
Monitor everything that happens on the PC.
*3-day trial version. Zip file password: wolfeye
**60 days money back guarantee. To unsubscribe / end the subscription just send us an email to “kontakt@wolfeye.de”
Supports Windows 11, 10, 8, 7, Vista & XP
Terms of Use:
Use of this software in an illegal manner or for illegal purposes is not permitted. The software may only be installed and run on your own devices. The use of the software and the use of the service on third-party devices without the consent of the owner / user is prohibited!
Features.
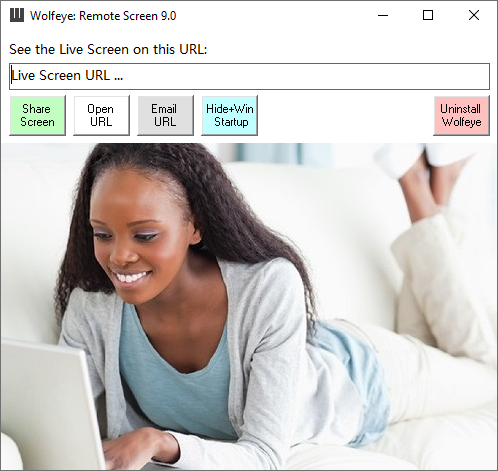
SEE LIVE PC SCREEN
See the live pc screen remotely over the internet using a web browser. As if you were sitting right in front of it.
In addition, the screen recordings can be archived / historicized / saved if desired. This way you can view the recordings at a later time. Activating this function requires sending an email to "kontakt@wolfeye.de" with the subject "Activate archiving" (also possible in the test version). Activation can take up to 1-2 hours.
SCREENSHOTS & VISITED WEBSITES
Take screenshots regularly and see what the user sees! Check visited websites and monitor surfing behavior! Because: the screen recordings can be archived / historicized / saved on request. This way you can view the recordings at a later time. Activating this function requires sending an email to "kontakt@wolfeye.de" with the subject "Activate archiving" (also possible in the test version! Please send an email!). Activation can take up to 1-2 hours.
INVISIBLE AND WINDOWS STARTUP
Runs invisibly and starts at Windows startup. Perfect for employee monitoring or son or daughter PC monitoring.
REMOTE MONITORING
Find out what is currently being done on the computer: is work being done productively or is time wasted on portals such as Facebook? Do you take part in online lessons or watch or play YouTube at the same time? You can conveniently see the PC live screen remotely via the Internet with a web browser. You can use any PC or even your mobile phone for this.
*3-day trial version. Zip file password: wolfeye
**60 days money back guarantee.
Supports Windows 11, 10, 8, 7, Vista & XP
Terms of Use:
Use of this software in an illegal manner or for illegal purposes is not permitted. The software may only be installed and run on your own devices. The use of the software and the use of the service on third-party devices without the consent of the owner / user is prohibited!
How can Wolfeye help you?

MONITOR UNAUTHORIZED PC ACCESS
Find out with Wolfeye Remote Screen if and who gets access to your computer without permission.
MONITOR YOUR CHILDREN'S INTERNET BEHAVIOR
Use Wolfeye Remote Screen to monitor what your kids are doing on the internet and who they are chatting with. Protect your children from bullying and exclusion by learning ahead of time when cyberbullying attacks occur. Check if your child visits inappropriate websites with bad content.
EMPLOYEE MONITORING
Monitor whether your employees are using their time productively with Wolfeye Remote Screen! Are your employees spending a lot of time on social media instead of doing their job? Do your employees have secret projects in which they work independently during working hours? This is often the case in industries such as architecture firms, where employees earn slightly more from these activities during working hours. Learn more: https://www.wolfeye.de/employee-tracking/
Remote Desktop
You can share the screen to collaborate with others in real time, or connect to another computer to help or get help remotely: https://www.wolfeye.de/remote-desktop-us/
ATTENTION WARNING
The legal possibility of using Wolfeye Remote Screen for employee monitoring must be checked individually by a lawyer. We do not give legal advice. The "Wolfeye Remote Screen" is PC monitoring software which theoretically can also be used for illegal purposes. Of course, this is not allowed: Wolfeye may only be installed and run on your own computer. Use on third-party computers without the consent of the owner is prohibited! Please refer to your local laws to ensure your particular surveillance activity is legal in your country. By installing the software or using the service, you confirm that you are acting in accordance with the law and accept full responsibility for the use of the product.
*3-day trial version. Zip file password: wolfeye
**60 days money back guarantee.
Supports Windows 11, 10, 8, 7, Vista & XP
Terms of Use:
Use of this software in an illegal manner or for illegal purposes is not permitted. The software may only be installed and run on your own devices. The use of the software and the use of the service on third-party devices without the consent of the owner / user is prohibited!

Imprint / Contact.
Angel Gonzalez
Höllbergstraße 4A
60431 Frankfurt am Main
Germany
+49 151 23 27 88 66
We look forward to your call. Of course, we are also happy to support you in setting up Wolfeye Remote Screen.
"kontakt@wolfeye.de"
We respond to emails very promptly - write to us.